

An S-curve in construction is a graph of cumulative project data — cost, work done, or man-hours — plotted against time. It forms a shallow "S": slow at mobilisation, steep through peak activity, then flattening towards completion. Quantity surveyors use it to compare planned progress against actual progress and spend.
S-curves are a core tool for tracking progress, controlling costs, and allocating resources on a construction project. This guide covers the technical and practical side of S-curves, from the mathematical foundation to advanced analysis techniques, in 10 parts.
1. What Are S-Curves and Why Do They Matter?
S-curves are graphical representations of a project’s progress over time, plotting time on the x-axis against performance metrics (e.g., cost, work completed, or resources) on the y-axis. Their characteristic “S” shape reflects the typical lifecycle of a construction project: a slow start due to planning and mobilization, rapid progress during peak activity, and a tapering off as the project nears completion.
Why They Matter:
- Cost Control: Identify budget deviations early to prevent overruns.
- Schedule Tracking: Ensure milestones are met on time.
- Resource Optimization: Allocate labor, equipment, and materials efficiently.
By integrating S-curves with tools like Earned Value Management (EVM) and Gantt charts, you gain a holistic view of project performance, enabling data-driven decisions.
.png)
2. The Mathematical Reasoning Behind the S-Curve Shape
The S-curve’s shape is rooted in the cumulative distribution of project effort, which often follows a logistic or sigmoid function.
This reflects the natural progression of construction projects:
- Early Phase (Slow Growth): Initial costs and progress are low due to planning, permitting, and site preparation. Mathematically, this is modeled as the lower tail of a logistic function:
where (L) is the maximum value (e.g., total budget), (k) is the growth rate, (t) is time, and t0t_0t_0is the midpoint of the curve.-
f(t)=L1+e−k(t−t0)
- Middle Phase (Steep Growth): As work accelerates (e.g., construction of structural elements), progress follows an exponential-like increase, representing the steep middle of the S-curve.
- Late Phase (Plateau): Progress slows as finishing tasks (e.g., painting, inspections) require less effort, approaching the upper asymptote of the logistic function.
This logistic model captures the cumulative nature of progress, whether measured in cost, work hours, or completed tasks, making S-curves a natural fit for visualizing project dynamics.
3. Types of S-Curves in Construction Projects
S-curves vary depending on the metric tracked and the perspective applied. Understanding these distinctions is critical for effective use.
- Cost S-Curves: Track cumulative or period-by-period spending against the budget.
Example: A cumulative cost S-curve shows total expenditure over time, while a period-by-period curve highlights weekly or monthly spending. - Schedule S-Curves: Monitor progress against planned milestones, often expressed as a percentage of work completed.
Example: A schedule S-curve might show 50% completion after 40% of the project timeline. - Resource S-Curves: Track labor, equipment, or material usage over time to optimize allocation.
Example: A resource S-curve could show cumulative labor hours, peaking during structural work. - Baseline vs. Actual vs. Forecast Curves:
- Baseline: The planned S-curve, set at project outset.
- Actual: Tracks real-time progress, overlaid on the baseline for comparison.
- Forecast: Projects future performance based on current trends.
.png)
If reconstructing what happened on site is costing your commercial team days every month, there is a faster way.
Gather's AI QS turns the daily record into a contract aligned commercial position automatically, so the claim writes itself from evidence instead of memory.
See the AI QS in actionA 30 minute call. No commitment. See if it fits how your team already works.
4. How to Create an S-Curve: Step-by-Step
Creating an S-curve is straightforward with the right approach. Follow these steps:
- Define Project Scope: Outline deliverables, milestones, and deadlines to establish the metrics you’ll track (e.g., cost, schedule, resources).
- Gather Data: Collect accurate data from site diaries, accounting software, or project management tools like Primavera or Procore.
- Plot the Data: Use software (e.g., Microsoft Excel, Microsoft Project) to graph time (x-axis) against the chosen metric (y-axis).
- Customise for Context: Adjust the curve for specific phases (e.g., foundation, framing) or metrics (e.g., labour vs. materials).
- Update Regularly: Refresh the curve with new data to reflect real-time progress.
Building your first curve is far easier if you start from a free S curve Excel template rather than a blank spreadsheet, and pairing it with a construction progress report template keeps your narrative and numbers aligned as the project runs.

5. Key Metrics and Formulas for S-Curve Analysis
S-curves are most powerful when paired with precise metrics, especially within Earned Value Management (EVM). Here are the key formulas:
- Planned Value (PV): Budgeted cost of work scheduled (BCWS). PV = Total Budget × Planned % Complete
- Earned Value (EV): Budgeted cost of work performed (BCWP). EV = Total Budget × Actual % Complete
- Actual Cost (AC): Actual cost of work performed (ACWP). AC = Sum of Costs Incurred
- Cost Variance (CV): Measures budget performance. CV = EV - AC (Positive = under budget; negative = over budget)
- Schedule Variance (SV): Measures schedule performance. SV = EV - PV (Positive = ahead of schedule; negative = behind schedule)
- Cost Performance Index (CPI): Measures cost efficiency. CPI = EV / AC (CPI > 1 = under budget; CPI < 1 = over budget)
- Schedule Performance Index (SPI): Measures schedule efficiency. SPI = EV / PV (SPI > 1 = ahead of schedule; SPI < 1 = behind schedule)
These metrics, plotted on an S-curve, provide a clear snapshot of project health.
6. Advanced Techniques for Analysing S-Curves
Beyond basic trend spotting, advanced analysis techniques unlock deeper insights:
- Curve Slope Analysis: Calculate the slope (rate of change) of the S-curve at different points to quantify progress acceleration or deceleration.
Example: A decreasing slope in the cost S-curve may indicate reduced spending due to delays or efficiency gains. - Variance Thresholds: Set acceptable variance ranges (e.g., ±10% for CV or SV) and flag deviations for immediate investigation.
- Trend Extrapolation: Use regression analysis to forecast future performance. For instance, fit a logistic model to the actual S-curve and extend it to predict completion dates or costs.
- Monte Carlo Simulation: Run probabilistic simulations to assess risks and predict outcomes based on S-curve data. This is particularly useful for large projects with uncertainty.
.png)
7. Integrating S-Curves with Earned Value Management (EVM)
EVM enhances S-curves by combining cost, schedule, and scope metrics. Here’s how to integrate them:
- Plot EVM Metrics: Graph PV, EV, and AC on the same S-curve to visualize performance gaps.
- Analyze Variances: Use CV and SV to identify whether issues stem from cost or schedule problems.
- Calculate Efficiency: Use CPI and SPI to assess resource efficiency and predict final outcomes.
- Forecast Completion: Estimate the project's final cost and timeline using:
- Estimate at Completion (EAC) = Total Budget / CPI
- Estimated Time to Completion = Planned Duration / SPI
This integration gives you a clear framework for cost and schedule variances before they become expensive.
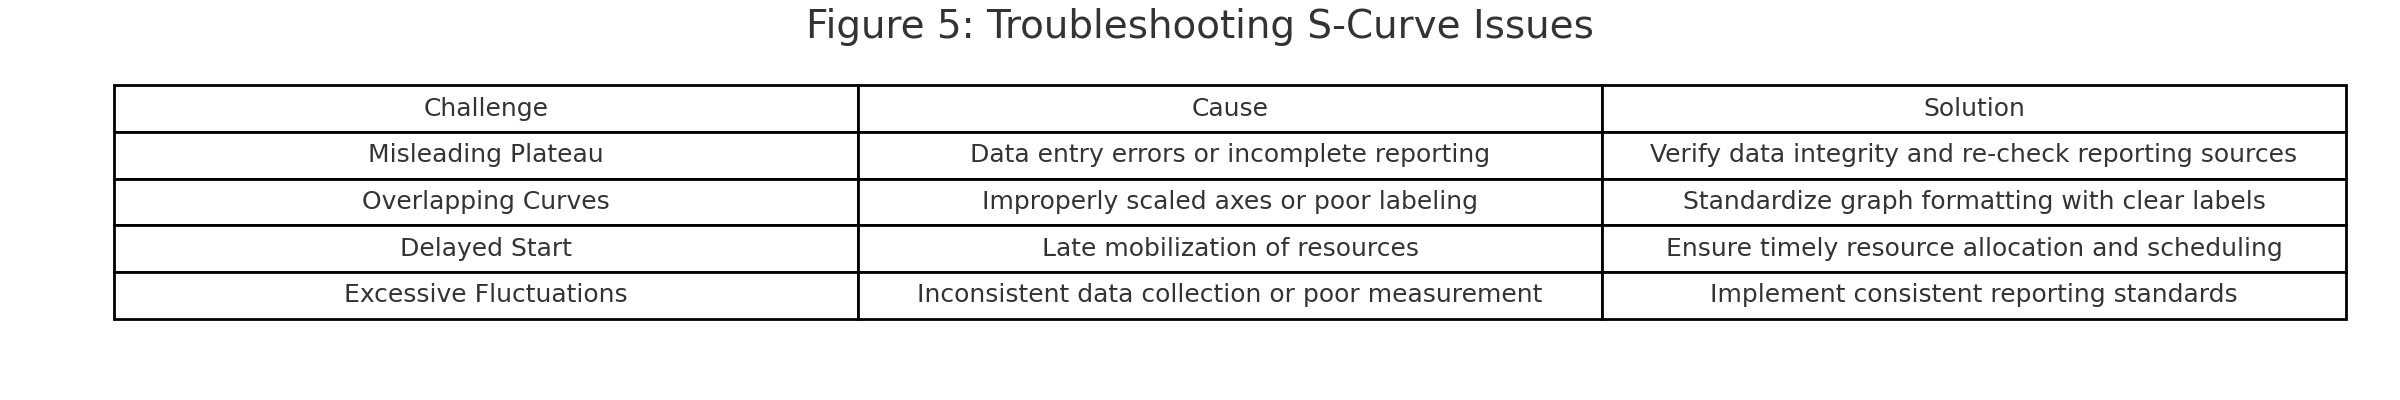
8. Common S-Curve Interpretation Challenges and Troubleshooting
S-curves can be tricky to interpret. Here are common challenges and how to address them:
- Challenge: Misleading plateaus (e.g., a flat curve mistaken for completion).
Solution: Cross-reference with schedule data to confirm if tasks are complete or stalled. - Challenge: Overlapping curves obscuring variances.
Solution: Use color-coded curves or separate graphs for clarity (e.g., cost vs. schedule). - Challenge: Inaccurate data skewing the curve.
Solution: Implement real-time data collection via tools like Procore or costed site diaries. - Challenge: Overemphasis on cost curves, neglecting schedule or resources.
Solution: Maintain balanced tracking across all S-curve types.

9. Best Practices for S-Curves Across Project Phases
S-curves are most effective when tailored to project phases:
- Planning Phase: Establish baseline S-curves for cost, schedule, and resources based on the project plan.
- Execution Phase: Update curves weekly or biweekly to track progress and adjust resource allocation.
- Monitoring Phase: Use variance analysis (CV, SV) to identify trends and implement corrective actions.
- Closeout Phase: Compare final actual curves to baselines to evaluate performance and document lessons learned.
Best Practices:
- Use software tools for automation and accuracy (e.g., Primavera, Microsoft Project).
- Involve stakeholders in reviewing S-curves to align expectations.
- Document deviations and corrective actions for future reference.
10. Tailoring S-Curve Updates to Project Size and Complexity
The frequency of S-curve updates depends on project characteristics:
- Small Projects (<$1M, <6 months): Update biweekly, as changes are rapid but data volume is manageable.
- Medium Projects ($1M–$10M, 6–18 months): Update weekly, balancing detail with resource constraints.
- Large/Complex Projects (>$10M, >18 months): Update daily or weekly, using automated tools to handle high data volumes.
Guidance: For complex projects, integrate real-time data feeds (e.g., IoT sensors for equipment usage) to ensure accuracy. For smaller projects, manual updates via Excel may suffice.
Final Thoughts
S-curves give construction project managers a clear, data-driven view of progress, costs, and resources. Combine them with EVM and the advanced analysis techniques above, and you can catch cost and schedule problems before they turn into costly pitfalls.
The S-curve formula
The simplest S-curve models cumulative percentage complete against time. A widely used parametric form is:
y = 1 − (1 − x^r)^b
where x is the fraction of time elapsed (0 to 1), y is the fraction of work complete, and r and b are shape parameters — for a typical construction curve, r ≈ 3 and b ≈ 9 give the classic slow-fast-slow profile. In practice most teams build the curve from the planned cumulative cost or man-hours each period rather than the formula — use the free template below.
Free construction S-curve template (Excel / CSV)
Download a ready-to-use S-curve template with planned, actual, and earned-value columns and a worked 12-month example. Drop in your own figures and the three S-curves chart themselves.
Frequently asked questions
What is the formula for an S-curve?
A common parametric S-curve is y = 1 − (1 − x^r)^b, where x is the fraction of time elapsed and y the fraction of work complete. On real projects the curve is usually built from cumulative planned cost or man-hours per period instead.
How do I create an S-curve in Excel?
List each period and its cumulative planned value, actual cost, and earned value. Select the period column plus the three value columns and insert a Line chart. The planned line is your baseline S-curve; actual and earned value show whether you are ahead or behind on cost and schedule. Use the free template above to start.
What does the S-curve tell a quantity surveyor?
The gap between the planned and earned-value curves shows schedule slippage; the gap between earned value and actual cost shows cost variance. Together they are an early-warning signal for compensation events and final-account exposure.
Key Takeaways
Related blogs you may like

Critical Path Method Definition, Analysis Benefits & How to Do It
Learn the Critical Path Method definition, how to do critical path analysis, and benefits for efficient project management.

Earned Value Analysis: 10 Essentials for Construction Projects
Earned value analysis compares planned, actual and completed work to show whether a project is on schedule and on budget. Here are the 10 formulas and terms you need to run it.

.webp)


